Memory: Don't Forget to Take Out the Garbage
Audio
DownloadVideo
Watch on YouTubeTalk description
JavaScript does a remarkable job of hiding memory management from us. What's going on behind the scenes?
Session Summary
Katie Fenn turns the invisible plumbing of JavaScript memory into something you can actually see and fix. She starts from the assignment operator and scope, contrasts the freedom and burden of C's malloc/free against V8's quiet diligence, then opens the hood on generational garbage collection: half-megabyte pages in the young generation, mark-sweep-compact in the old, and the new concurrent marking that keeps your scroll smooth. The payoff is a working diagnostic kit using Chrome's Task Manager and Memory panel to catch the four classic leaks before a Hello World balloons to 500MB.
View detailed generated session topics, quotes and video timestamps
Memory is a finite resource (1m03s)
Katie Fenn opens with the framing: every device has a memory ceiling, an iPhone 6 has 2GB and a developing-world handset has a fraction of that, and JavaScript apps have an inexhaustible appetite for new ways to consume whatever you give them.
"memory is fundamentally important for running our applications and our websites. It's a finite resource"
"as new devices are given more memory, our apps discover ever more creative ways of consuming it again"
"as developers we're often told that memory is important, but the truth is that JavaScript does a remarkable job of managing it for us"
What memory does and how it's allocated (3m11s)
A short detour through Colossus (no memory, you had to rewire it) and modern DIMMs (lightning-fast RAM) explains why stored-program computers needed memory — and then how browsers carve out heaps within heaps, with a dedicated JavaScript heap inside the page's overall heap.
"memory is used to store the most important instructions and data used by applications on the computer at a given moment"
"if you wanted to reprogram this computer, you can't just type it into a keyboard, you'd physically have to unplug wires and plug them in at a different place"
"inside our browsers, they allocate a heap within a heap just for the JavaScript data that our JavaScript is using"
Scopes, assignment and how JS deallocates (6m23s)
The = is properly called the assignment operator; declaring a variable allocates the memory, assigning gives the address its value. JavaScript reclaims that memory by tracking scopes — when a scope ends, anything only used inside it can be discarded.
"JavaScript allocates memory for us when we declare variables"
"if the heap is a farm, then a scope is a field"
"variables are only retained as long as their parent scope exists, and understanding scopes is the key to understanding how JavaScript manages memory"
Garbage collection vs manual memory management (8m30s)
Contrast with C: malloc(10 * sizeof(int)) and free(ptr) give you full control and full responsibility for every byte. JavaScript belongs to the garbage-collected family — a lot of work you don't have to worry about — and the rest of the talk is what that work actually is.
"JavaScript belongs to a family of languages called garbage-collected languages, and really if you bore that down, it just means that JavaScript does a lot of work that you don't have to worry about"
"this is a lot of control over your memory, but it's also an awful lot of work"
"you also have to keep very, very close track of all the data that's in your system"
The young generation and minor collections (10m41s)
V8 splits the heap into young and old generations because most variables are short-lived. New objects land in the young generation in half-megabyte pages; when one of its semi-spaces fills up, a minor GC runs in about a millisecond, tracing references to find which objects are still reachable and discarding whole pages of garbage.
"all new variables are created inside the young generation, and they're created here in half-megabyte pages"
"any objects that can be traced are considered alive, and some of those objects that can't be traced will be considered dead"
"a minor garbage collection takes as little as one millisecond — it's very, very good at its job"
Major collections and concurrent marking (13m21s)
Anything that survives two minor collections is promoted to the old generation, which runs a mark-sweep-compact major GC. Marking is the bit that blocks — up to 100 ms on a large heap — so V8 breaks marking into 1ms chunks and now does 70–80% of the work concurrently in the background.
"the major garbage collector uses a mark-sweep-compact garbage collection"
"marking can block your application — some processes marking can mean that your application isn't doing things like responding to user input or scrolling"
"V8 has recently added concurrent marking, allowing 70% to 80% of this marking to happen in the background"
WebAssembly and its own memory (16m32s)
WebAssembly modules own their own memory and bypass the JavaScript garbage collector entirely — which is what makes Unreal Engine demos in the browser viable. (Lin Clark's JSConf EU talk is the recommended deep dive.)
"WebAssembly is a way of running languages other than JavaScript to work alongside JavaScript in the browser"
"compiling languages like C opens the doors to running much more high-performance applications in the browser"
"WebAssembly applications have ownership over their own memory — this allows more efficient manual memory management to take place, free of the influence of JavaScript's garbage collector"
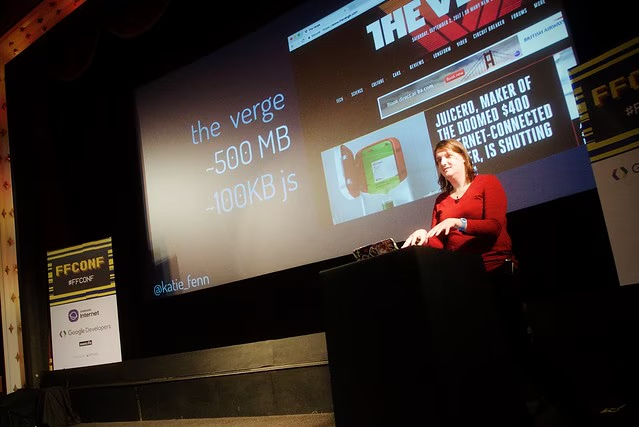
Memory bloat: the 100MB Hello World (18m33s)
A Hello World page already consumes about 100MB of memory and 3KB of JS heap; a busy production page hits 500MB. Chrome's Task Manager (More Tools → Task Manager) is the right place to see whether the bloat is HTML/CSS or JS heap.
"the baseline consumption for a Hello World application... is around 100 megabytes"
"a really crowded web page might consume 500 megabytes... that's a quarter of the amount of memory used by [a 16GB laptop]"
"you should only use the amount of memory that's needed to serve the purpose of your application"
Memory leaks and how DevTools finds them (22m14s)
The four classic JavaScript leaks — accidentally-global variables, intervals that capture a parent scope, event listeners that keep a closure alive, and orphaned DOM nodes accumulating in arrays — each show up as a clearly upward-trending sawtooth in the DevTools Performance memory graph, and the Memory tab's detached-DOM filter will hand you the exact array holding them.
"if the heap size is larger on the right-hand side than it is on the left, that is a classic sign that you have a memory leak"
"because the
resultsvariable was declared without avarkeyword, that data is created in the global scope"
"[in DevTools Memory] you can filter it by detached, and it will show you a list of all the detached DOM nodes — by clicking on it we can see that all these objects are stored inside an array called
buttons[]in the global window scope"